
Tierra Catalina Condominiums
Data as of May 21, 2026
Market insights · Jan 2022 – May 2026 · 44 listings (38 closed, 6 active)

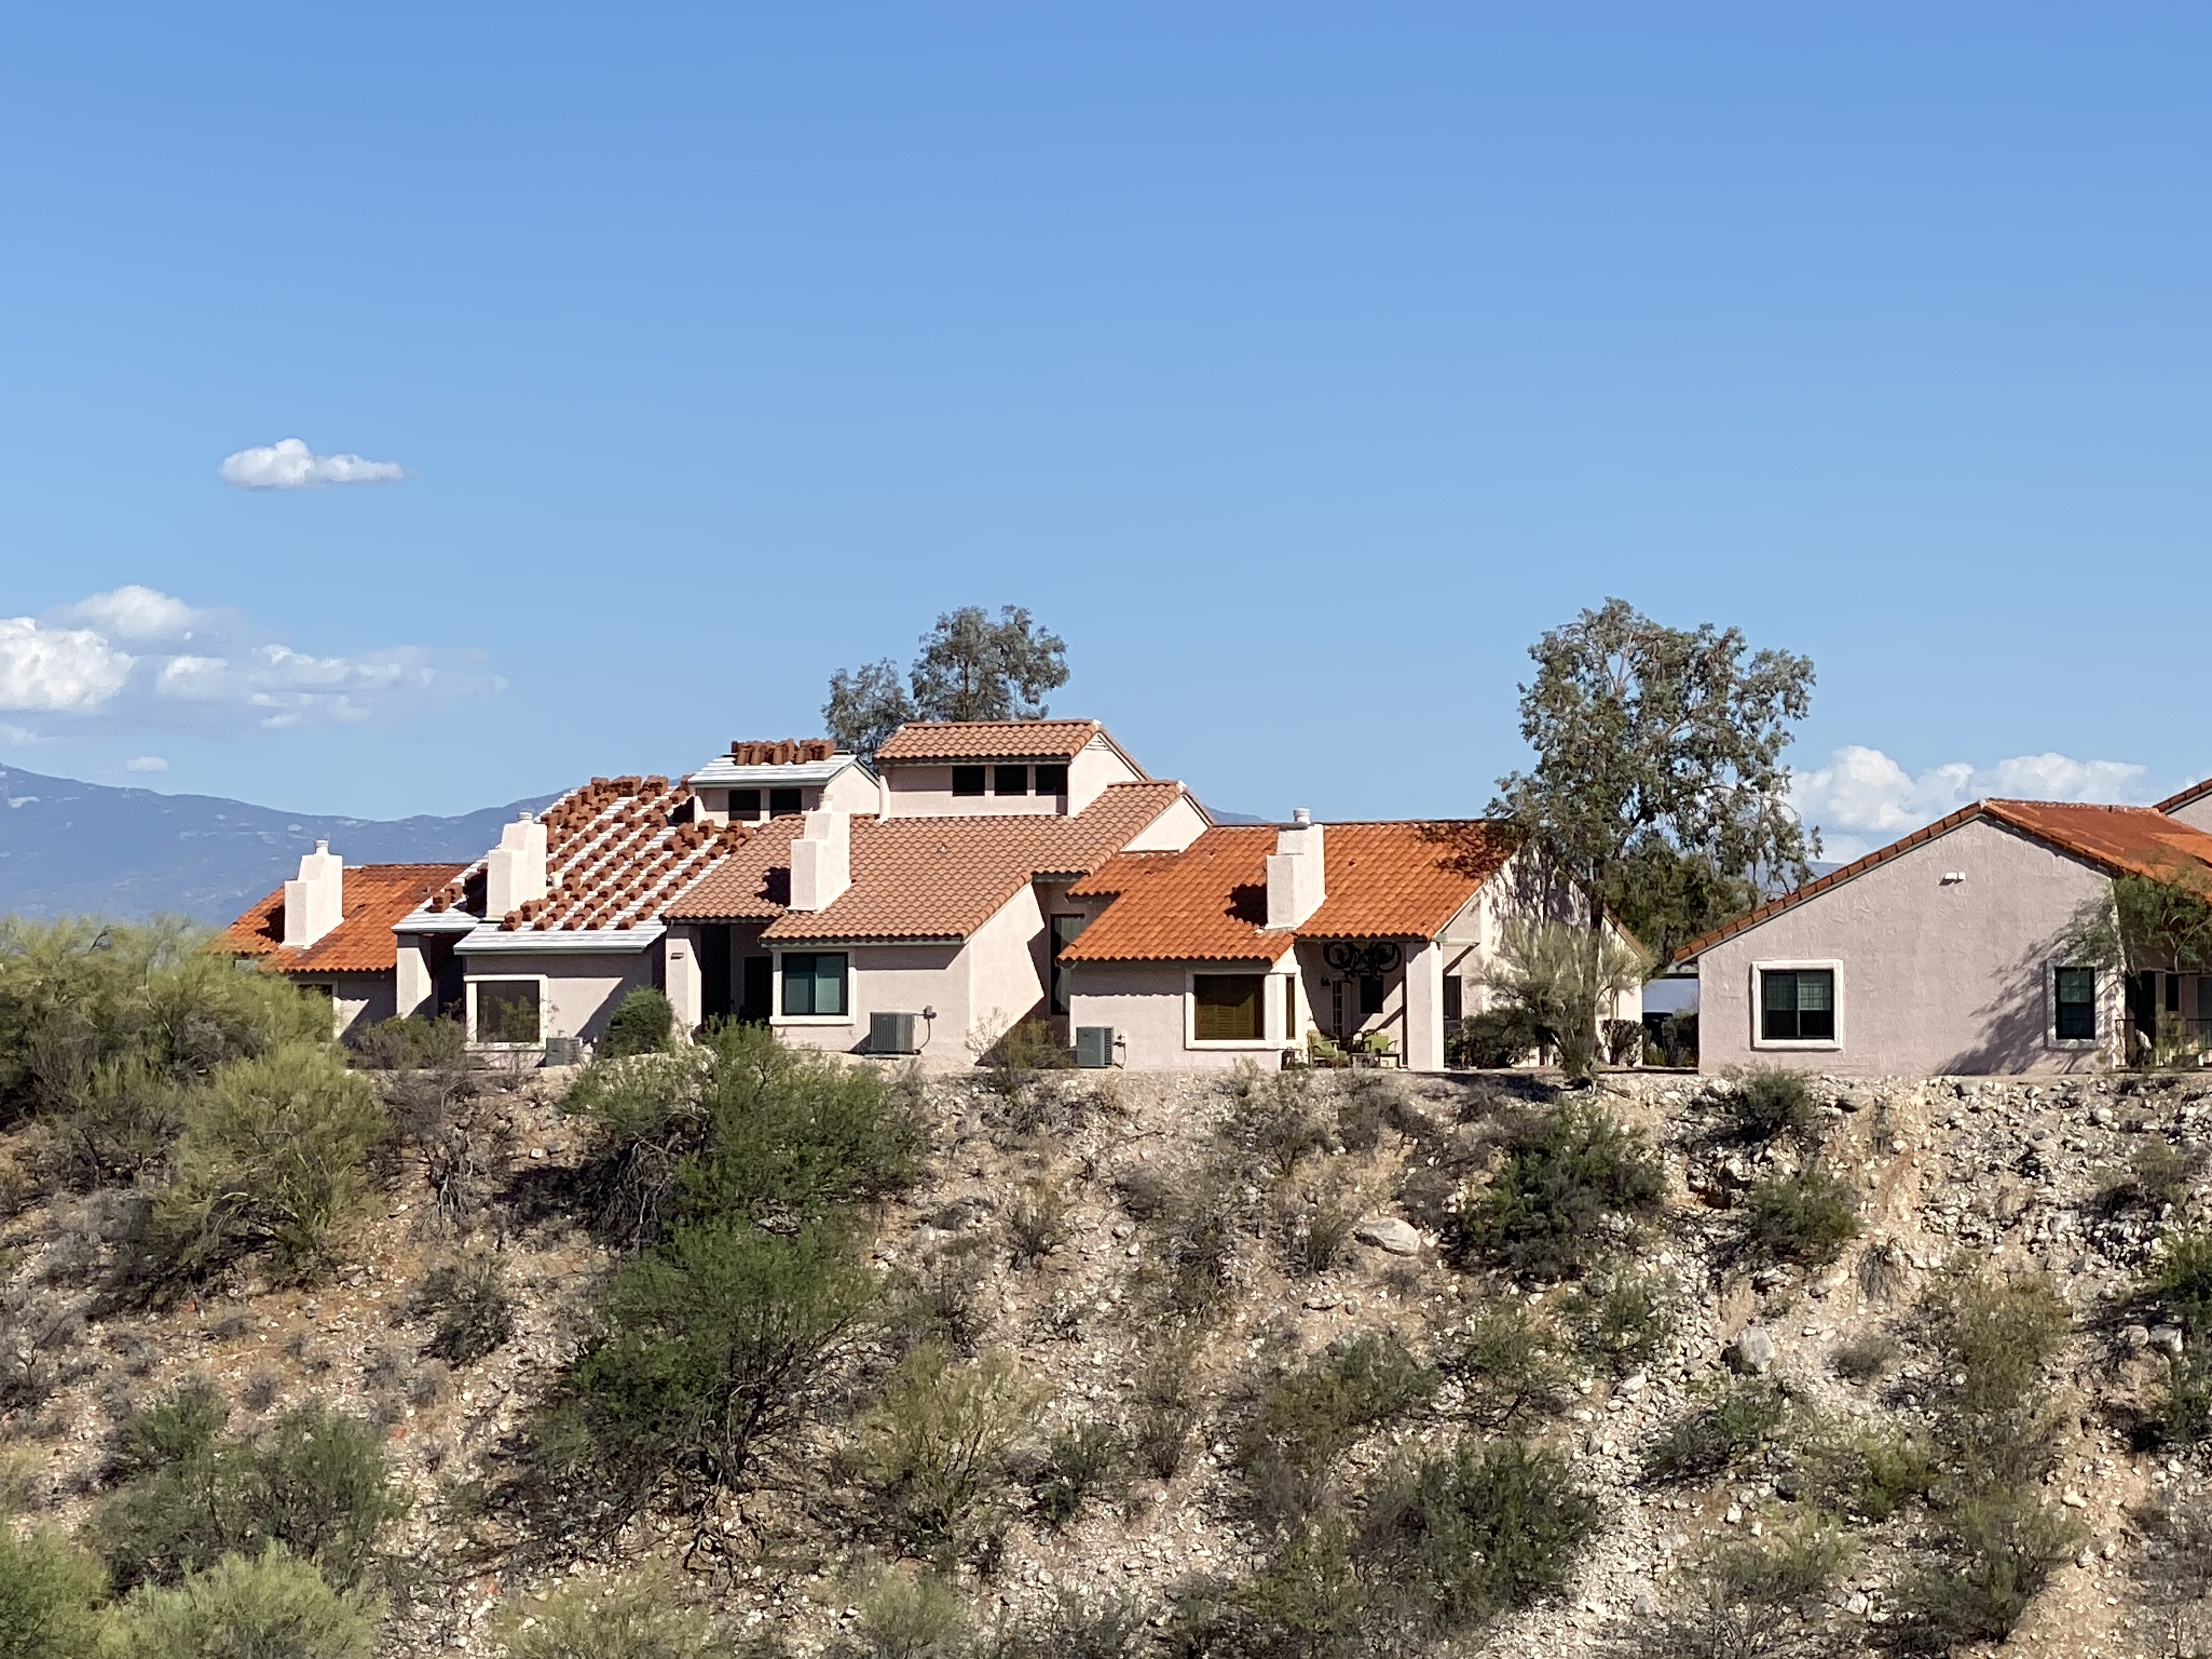
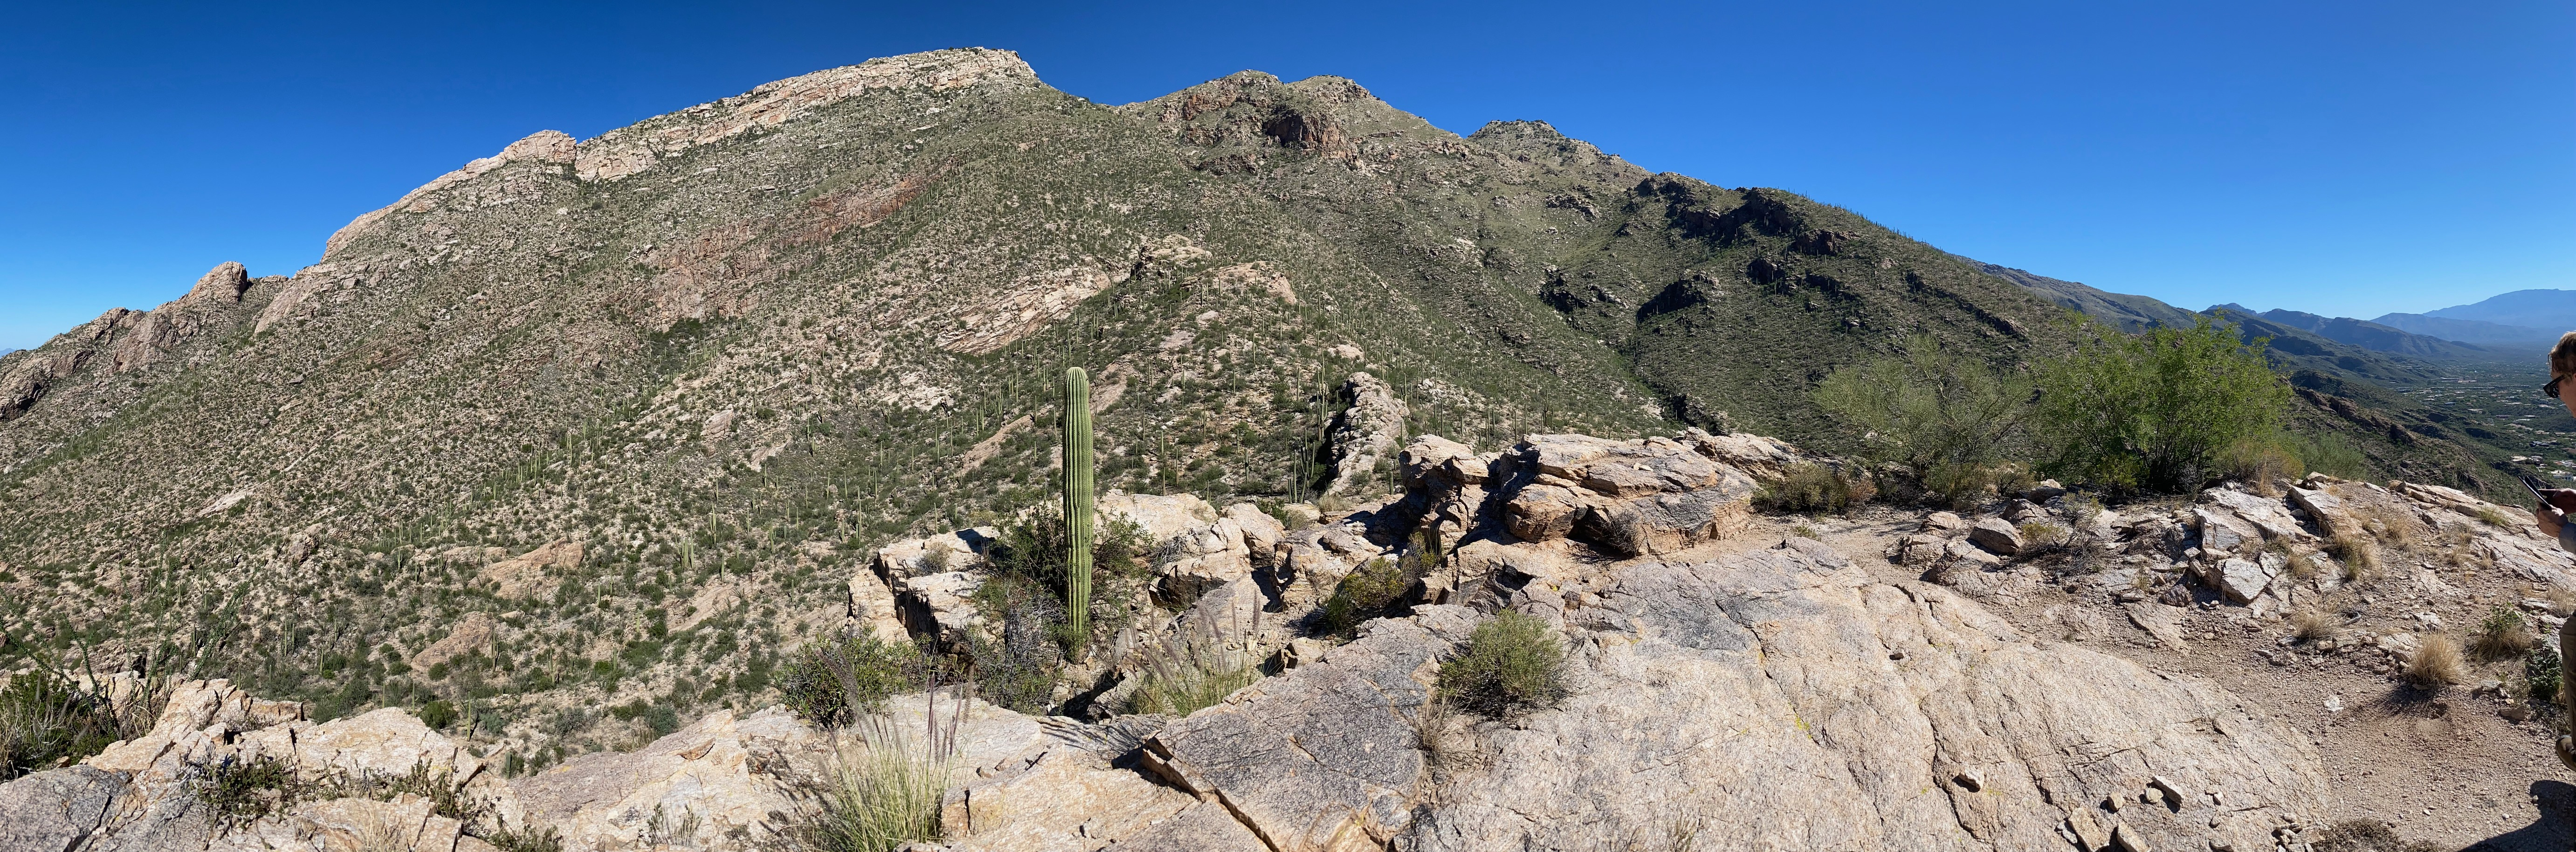
Tierra Catalina Condominiums in Tucson, Arizona consists of 120 units in 1-, 2-, and 3-bedroom floor plans. All units have an outdoor patio or balcony. Many have vaulted ceilings, giving them a spacious feel. The development was built in 1983 and operated as rental apartments until conversion to condominiums in 2005. Exterior maintenance is handled by the HOA. Given the age of the buildings, the HOA has begun to replace roofs on units as needed. The neighborhood has a beautiful pool and spa, as well as a tennis court. It is walking distance to many restaurants and shops at the corner of Skyline and Campbell, including La Encantada shopping center.
| Status | Beds | Sqft | Orig list | Current list | DOM |
|---|---|---|---|---|---|
| Active | 1BR | 913 | $250,000 | $247,000 | 28 |
| Active | 1BR | 934 | $249,900 | $234,900 | 57 |
| Active | 1BR | 934 | $300,000 | $290,000 | 133 |
| Active | 2BR | 1,259 | $290,000 | $290,000 | 113 |
| Active | 2BR | 1,259 | $339,999 | $269,100 | 398 |
| Active | 3BR | 1,571 | $320,000 | $320,000 | 8 |
| Avg sold price | Sold / list | Avg DOM | Active | |
|---|---|---|---|---|
| 1 bedroom (n=15) | $251,565 | 100.6% | 33 days | 3 |
| 2 bedroom (n=17) | $295,676 | 100.6% | 28 days | 2 |
| 3 bedroom (n=6) | $331,750 | 100.1% | 20 days | 1 |
2022 — a strong seller's market. With 15 sales at an average sold/list ratio of 104.4%, homes were routinely selling above asking price — sometimes well above. Average days on market was just 11. Several 1BRs sold 10–16% over list, and 2BRs regularly commanded $20K–$35K premiums. This was the peak competitive period for buyers.
2023 — the market normalizes. Only 5 sales were recorded, and the sold/list ratio fell to 99.5%, right at parity. DOM crept up to 25 days. One 2BR sold at a notable 7.4% below list after 111 days on market — an early sign that overpriced listings were no longer moving quickly.
2024 — highest prices, but buyer leverage returning. Average sold price peaked at $306K, yet the sold/list ratio slipped further to 97.1% and DOM rose to 35 days. Several listings required price reductions before selling. The market was active but sellers could no longer expect above-asking results.
2025 — prices soften, days on market spike. Average sold price dropped to $275K — the lowest since 2022 — and DOM jumped to 76 days. Two listings took 138 and 174 days respectively. A 1BR that originally listed at $355K sold for $225K (37% below original list). The market clearly shifted toward buyers.
2026 (partial, 4 sales through May). DOM has come back down to 18 days on average and the sold/list ratio is holding at 97.9%, suggesting the market may be stabilizing at a lower price level. Average sold price so far is $260K.
By bedroom. More bedrooms mean higher prices and faster sales across all years. 1BRs average $252K and 33 days on market; 2BRs average $296K and 28 days; 3BRs average $332K and 20 days. Notably, 1BRs command the highest price per square foot ($273/sqft) — likely because smaller units attract a broader pool of buyers including investors and renters.
Active listings to watch. The 2BR listed since April 2025 (now at 398 days on market, originally $340K, now asking $269K) stands out as the most challenged listing in the dataset. The other five actives range from 8 to 133 days — more typical, but worth monitoring given the softened market conditions.